
This is a principle I learned when I was 15 years old and flipped burgers at McDonald’s. Why do you teach 15-year-olds such a principle? Because, when there are no guests in the restaurant, you want them to spend their time preparing for the next. When the next guests arrive, you operate more efficiently and improve their experience. I was recently reminded of this principle in a completely different context, working with the nightlife group, REKOM, to re-calibrate their operating model.
The pandemic has been challenging to the nightlife industry – to put it lightly. Sudden closures, restrictions, and a jungle of compensation schemes are not ideal when you want to operate bars and restaurants efficiently. As such, I was quite surprised when I got a phone call in February and a senior finance employee from REKOM was at the other end of the line. And even more surprised when he wanted our help to solve a critical analytics problem.
For those of you who are not that familiar with REKOM, I can say that you have most likely visited one of their many bars and nightclubs. Here is just a little bit of background before we deep dive into the data and analytics case, REKOM wanted us to help with.
The Problem
The Problem
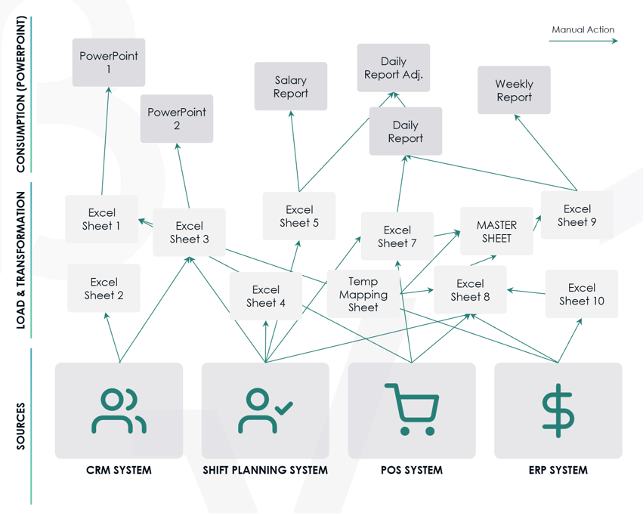
REKOM was having all their data stored in non-analytics-ready environments. Companies facing this problem, generally experience three pains:
- All their data is sitting in several dispersed source systems. To analyze the data, you need to ‘open’ each system one at a time
- The data sources are not joined or ‘mapped’ to each other. This makes it quite difficult to look across sources and see correlations. E.g. how many people are staffed during peak hours? One system shows your sales. Another system shows your staffing. But there’s not a platform that shows both together
- Data retrieval is manual. Manual labor spent on moving data is expensive and cumbersome
Why should we do something?
Occasionally, reporting has to be done. This can be daily, weekly, monthly, quarterly, you name it. Each time the company wants to get insights, all the above pains have to be endured to some extent.
If we solve this problem, we can eradicate the three pains (a huge win in itself). But we can also open up the huge potential in using our data in a much more sophisticated manner – getting unique insights, enabling operational optimization and revenue!
To build on the above example – if you are a Bar Manager, you want to do bar management, not staffing nor battling data extracts and excel sheets. And why should you guess on optimal staffing? Why should you spend time consolidating data to report to management? Why shouldn’t you get recommendations on optimal bundles of products instead of guessing?
Ultimately, solving “The Problem” will allow you to do specialized tasks that you’re passionate about.
The Solution
The Solution
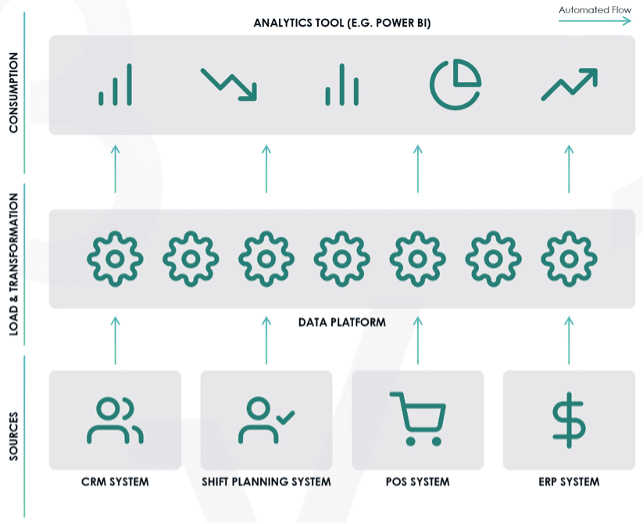
We need a place where data is ingested, transformed and pushed to a decision-making tool. Such a place, we can refer to as a ‘data platform’. Our data platform can ‘talk’ to our source systems and get data at a set frequency. The data is then stored in the cloud and accessed by a front-end tool afterwards (e.g. Microsoft Power BI). In this manner, we create a data pipeline where data is constantly ingested from sources and presented for actionable insights.
So what did we build?
A cloud platform in Azure that consists of the following component parts:
a. Data Factory: A service that talks to the APIs of our source systems get data and moves it
b. Data Lake: A place where we can store data cheaply in raw format. Basically just a large folder structure
c. SQL database: A place where data is stored in transformed format and made ready to use for data models
d. Power BI: The place where data from the SQL database is modeled and consumed by business users. Here, we can get creative, create visualizations and explore our data
We have then integrated a number of data sources into our flow (a-d), i.e. written code.
What was the impact?
What was the impact?
Carl-Johan Helbo Andersen (Head of Finance Operations, REKOM) elaborates
“In REKOM we care a lot about decentralizing as much responsibility as possible to our operations, i.e. Venue (Store) Manager, and our rapidly growing organization has made it necessary for us to build a scalable business intelligence solution that is easily distributable, near real-time and has high-quality insights, that our managers can use to leverage their business on a daily basis.
Power BI has really solved the distribution part and combined with the extremely strong foundation that we’ve built in the cloud platform, the quality and flexibility of our reporting has never been better. Moreover, the data warehouse strategy has also been applicable to all of our financial group reporting, which means that our monthly consolidation process is very smooth and automatic and that we have very thorough insights into all the financial reporting that goes to our board and stakeholders. So, we have definitely freed up a lot of time from people making manual reports in the organization.”
Final Remarks
The concept of data platforms is relatively new and is becoming more and more accessible as the cloud computing revolution is taking off. Costs are also becoming much more transparent (and lower). For any company that is still operating without a data platform, there is a huge potential in utilizing the scalability and performance of these technologies to create a competitive advantage. Just like REKOM is doing.
Kudos to the REKOM team for tackling a black swan event with a huge amount of bravery and optimism by making value-adding investments in optimizing their operating model and guest experience. This is a winning culture and a winning company that has been cleaning instead of leaning. We cannot wait to see them take off during this re-opening.
Cheers!
Get in touch
How we help you accelerate your business intelligence journey
Read more about our experiences with BI & Analytics
All cases

And don't worry, we will not use your information to spam you with buzzfilled articles on AI.